Understand your money in a minute.
Income versus expenses month by month, the categories where you spend most and a full-year profit and loss table. All calculated from your transactions.
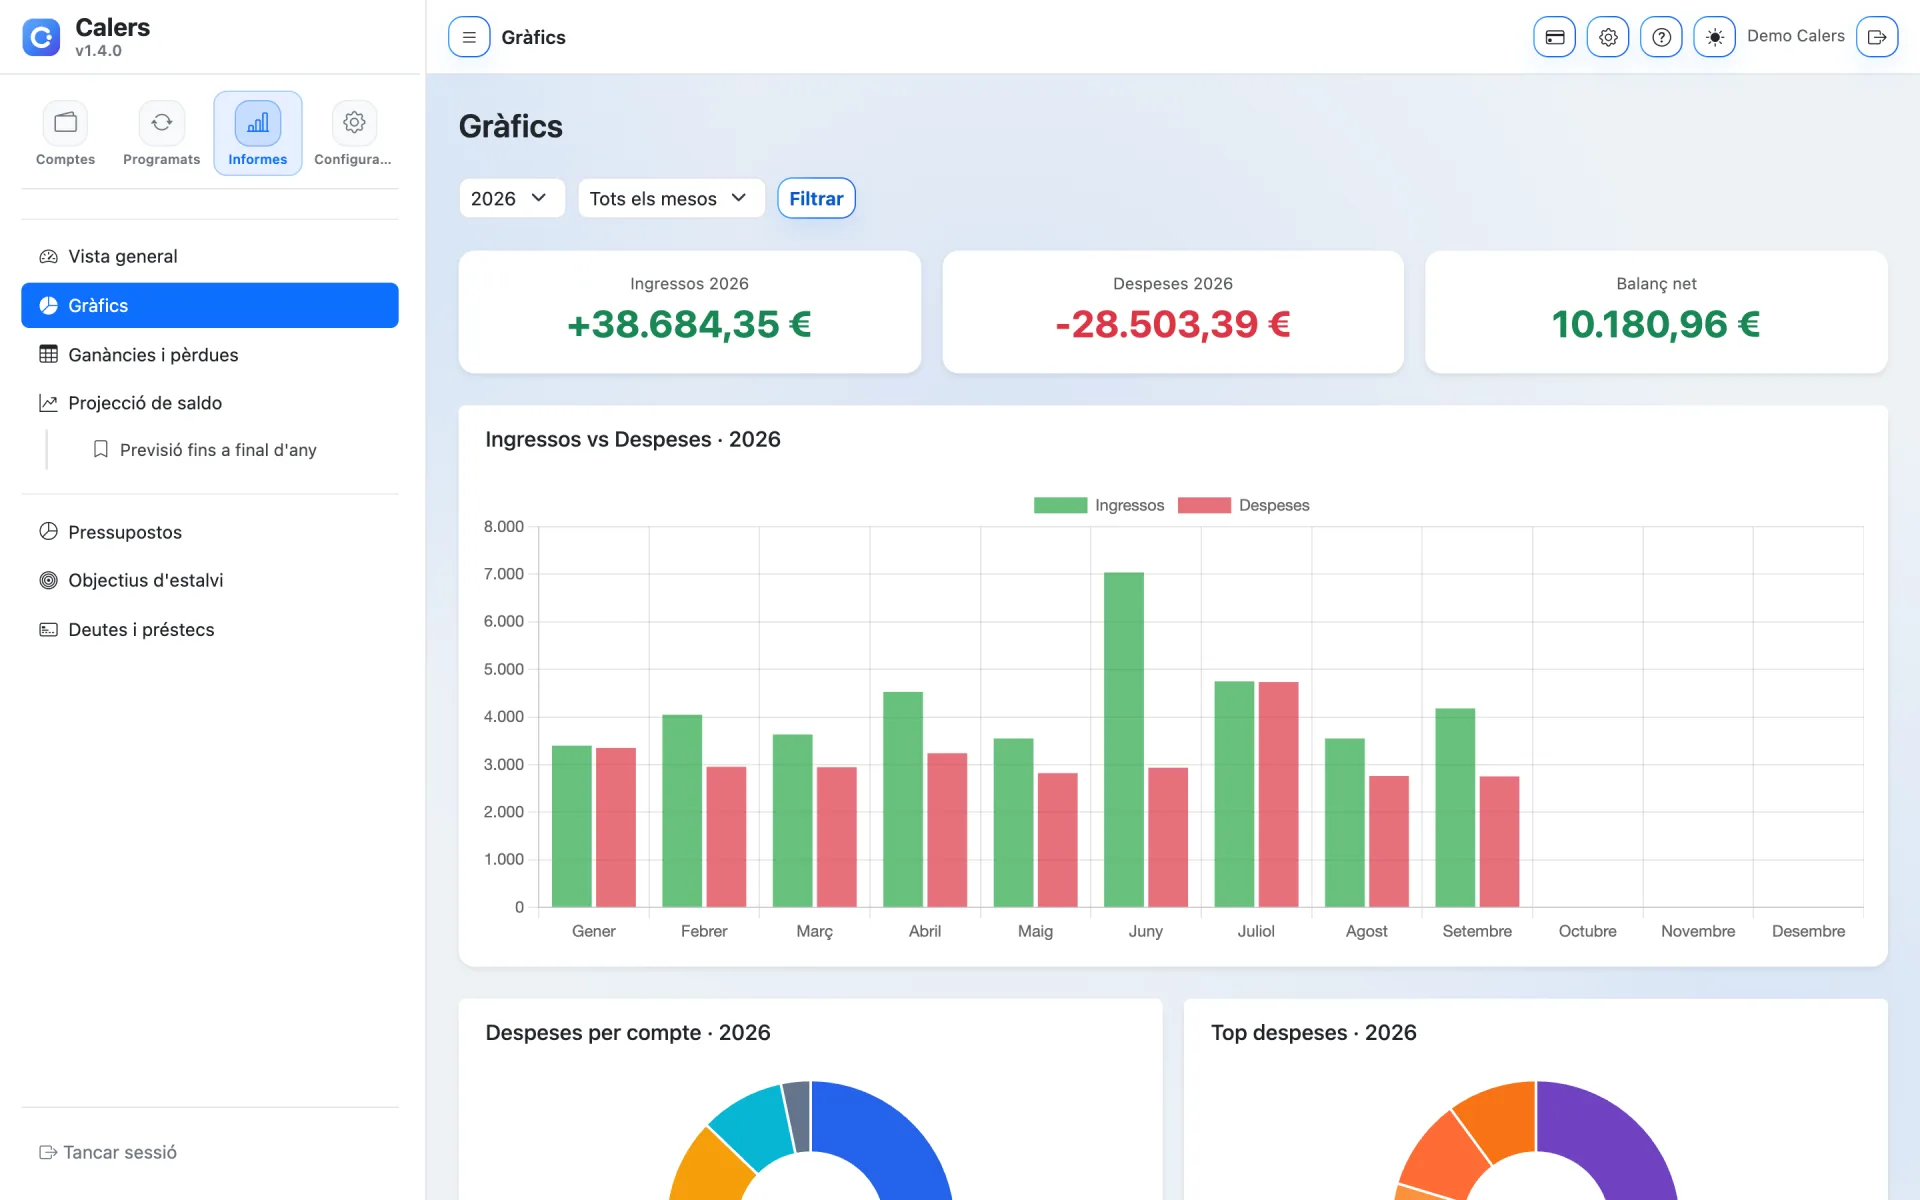
Monthly charts
Income and expense bars for every month and the net balance for the year.
Profit and loss
A table by category and month, with income and expense totals and subcategory detail.
Filter by period
Choose the year and month to analyse exactly the period you’re interested in.
Export to PDF and CSV
Download reports and transactions to share or archive them.
The whole year in a single table
Each row is a category and each column a month. See where you spent most, which months were unusual and how much you really saved.
- Income first, then expenses, with totals
- Expand subcategories to see the detail
- Open any amount to see the transactions behind it

The metrics that matter, on the first screen
The overview sums up the current month: income, expenses, closing balance, budgets and goals. Everything you need to know if you’re on track.
- Total net worth, always up to date
- Budget and goal progress
- Latest transactions from all accounts

Get your money in order today
Create your account in a minute and try Calers for 7 days without paying a thing.